
Your climate risk is not in a country. It is at a plant, in a process.
A new paper from the Free University of Bozen-Bolzano, co-authored by two of our founders, shows how to move from macro climate data to site-level exposure inside the business processes that matter. What it finds, what it does not claim, and how SONAR keeps the picture current.
Most climate analysis stops at the country, the sector or the listed firm. A risk manager cannot act at that level. The decision object is a specific plant, warehouse, hospital or data centre, with a specific production value and a specific organisation behind it.
The paper From Macro Climate Risk to Site-Level Corporate Loss: A Geoclimatic Probable Maximum Loss Framework (Carturo, Cortolezzis, Domenichini, Ferrari, Ravazzolo), co-authored by two of our founders, Pietro Domenichini and Francesco Ravazzolo, is now out in the Bozen Economics & Management Paper Series (BEMPS No. 121, 2026). It introduces GCPML, a transparent chain from physical hazards at a verified facility, through damage mechanisms and eleven business processes, to a monetary exposure that is adjusted by what an audit says about the organisation's resilience.
What a first test on 17 audited sites shows
The pilot covers 17 sites in 13 countries and EUR 1.128 billion of annual production.
Addresses mislead. Six address-derived locations were more than one kilometre from the verified facility; four of them were labelled "high precision" by the geocoding service.
Location is not enough. Coordinate-only screening keeps most of the site ranking (Spearman 0.917) but identifies the dominant process area at only five of 17 sites. The audit changes the answer at the other twelve.
Averages hide. In the 2050 window the portfolio aggregate rises 2.1% while the median site rises 11.2% and the worst site 35.1%, because one large site (39% of production value) improves.
What we do not claim
This is a feasibility and diagnostic study. It does not estimate a loss quantile, a return period or predictive accuracy, and it is not an actuarial calibration. Six hazards of a 17-hazard catalogue are populated, nine of 17 sites belong to one group, and no realised loss claims were available. The paper says so, and so do we.
Why SONAR
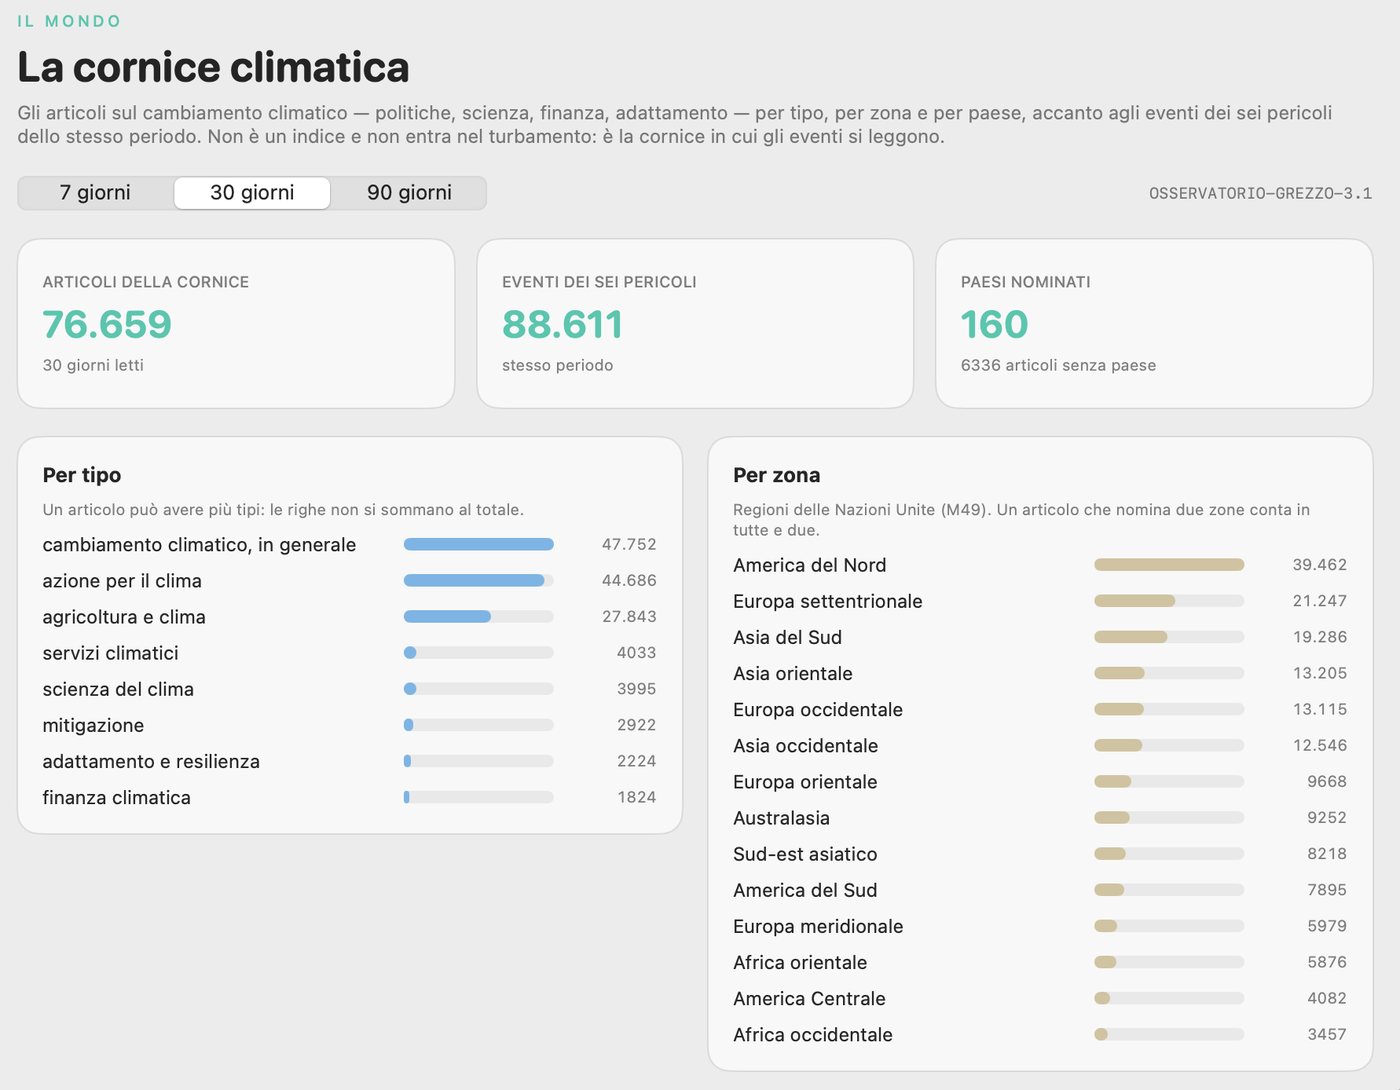
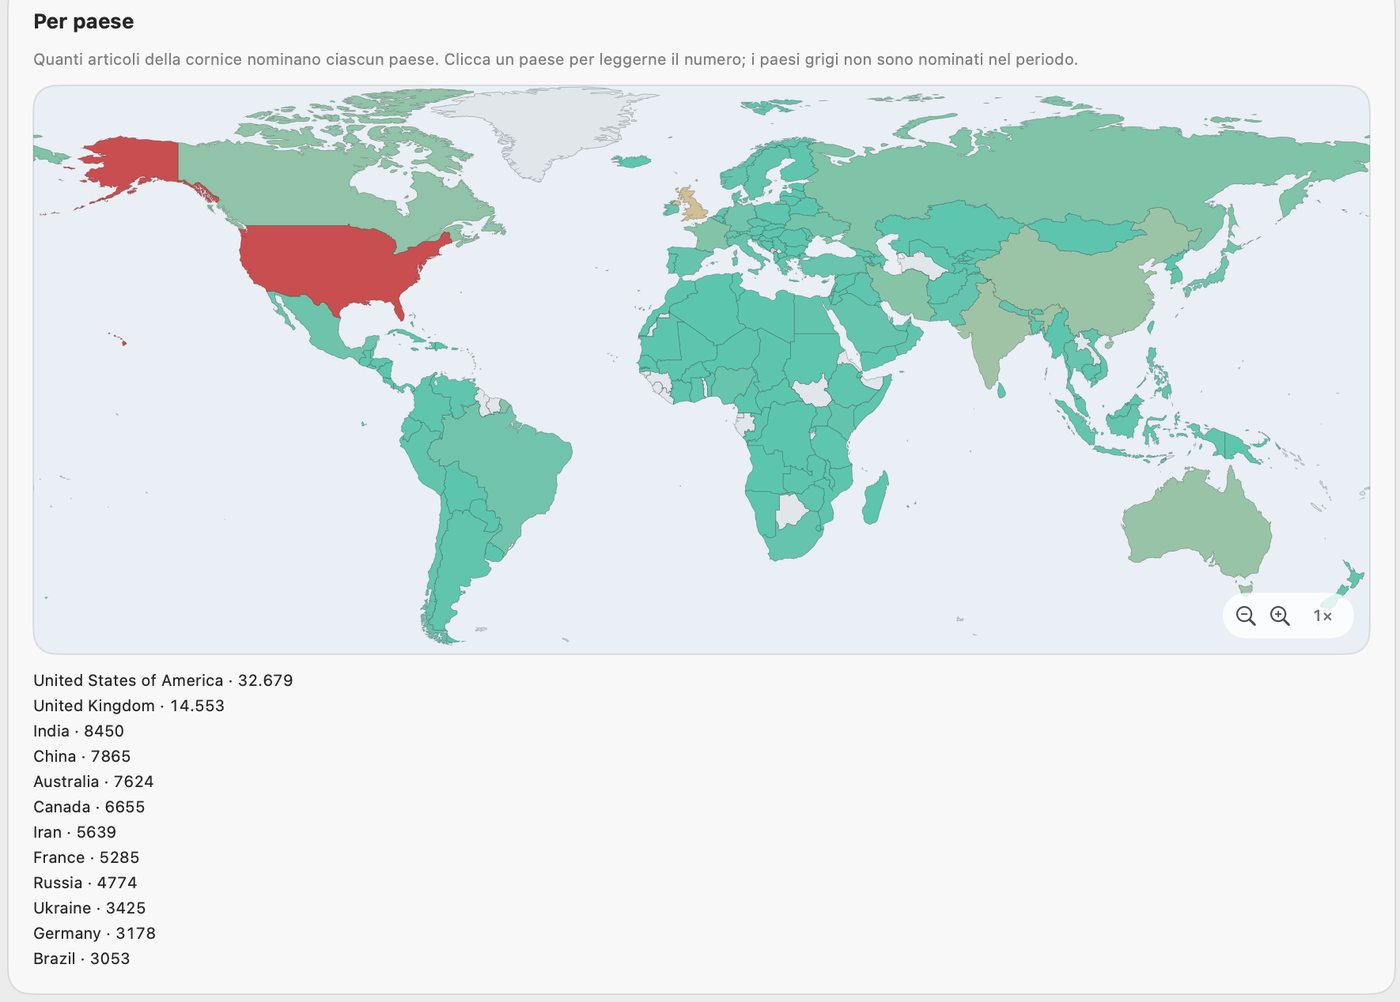
A method like this earns its value when it is watched continuously, with sources and dates you can check. SONAR, our monitoring platform, keeps a daily view of the climate frame — events across the six hazards by type, zone and country — and flags days whose data collection is not complete. Each figure carries its source and date so that anyone can reproduce it. SONAR does not replace the audit or forecast losses; it makes the exposure picture continuous and comparable over time.
If you manage multi-site operations and want to see how site-level geoclimatic exposure would look for your own portfolio, talk to us.
Sources
This article is informative and does not replace professional advice on a specific case.